
The Graph Price (GRT)
- Here you can see the current The Graph price (GRT) and an overview of its historical.
- As of today (06.10.2026), the current The Graph (GRT) price is at 0.0263 EUR, a -1.68% decreased as the previous day (05.10.2026) of 0.0268 EUR.
- The Graph (GRT) is one of the crypto currencies you can trade at BISON.
Trade with BISON The Graph
- Crypto and securities on one platform
- Simply trade crypto without any fees* Only a market-standard spread applies.
- Over 1.050.000 users trust BISON
The Graph - Price Data
- High 24h
- 0,0273 €
- All Time High
- 2,34 € 98,9%
- Days since All Time High
- 2.062 (11.02.2021)
- Low 24h
- 0,0256 €
- All Time Low
- 0,0112 € 135,0%
- Days since All Time Low
- 49 (18.08.2026)
The Graph - Market Data
- Popularity
Popularity by market capitalization. The cryptocurrency with the highest market capitalization ranks 1st.
- Rank 147
- Trading Volume
A measure of the trading volume of cryptocurrencies on all tracked platforms in the last 24 hours. This volume is continuously tracked over the entire 24-hour period without opening or closing times.
- 15.262.883,00 €
- Max Supply
The maximum number of coins set during the lifetime of a cryptocurrency. This is comparable to the maximum number of shares that can be issued on the stock market. Maximum supply = theoretical maximum as set in the code.
- 0
- Market Cap
Market capitalization is calculated as the current price multiplied by the circulating supply. This term refers to the total market value of a cryptocurrency's circulating supply. It is comparable to the measurement of the stock market where the price per share is multiplied by the number of freely available shares.
- 288.117.475,00 € 3,9%
- Circulating Supply
The amount of coins circulating in the market and publicly tradable. This is comparable to the consideration of shares available in the market.
- 10.941.320.353
- Total Supply
The number of coins that have already been created, minus any coins that have been removed from circulation. Total supply = blockchain supply - removed tokens.
- 11.612.995.353
GRT calculator:
Calculate how much grt you get for your Euro money
Table of Contents
What is The Graph about?
Imagine you want to build an application that allows you to analyze the number of transactions on the Ethereum blockchain and present them in the form of graphs and tables. To do this, you need the data in a database. You could commission a database developer to extract all Ethereum transactions from an Ethereum node and store them on a separate server. This data must also be prepared by the database expert so that the data can be used in tools such as PowerBI.
The Graph is tackling this challenge. The blockchain project aims to provide “access to global blockchain data”. The Graph is a service that provides the desired data and charges a fee for it. This saves the company development work and server costs.
Subgraphs as a data source
Subgraphs are open APIs on The Graph that organize and provide blockchain data for applications. Suppose you want to know how many transactions are happening on the Ethereum blockchain. In that case, you can retrieve this data from the corresponding Subgraph (API) and use it for your application. Currently, The Graph supports about 40 blockchain networks, including well-known ones like Ethereum, BNB, Polygon, Avalanche, and NEAR.
Projects using The Graph
On their website, well-known blockchain projects like Uniswap and the Bored Ape Yacht Club are mentioned. NFT transactions, based on a smart contract, contain only basic information, like the owner. To find out how many Bored Apes a specific Ethereum address owns and filter these NFTs for certain properties requires additional information. The Graph explains, “To get this data, you would need to process every single transfer event ever sent, […] and aggregate it. Even for these kinds of relatively simple questions, it would take hours or even days for a decentralized application (dApp) running in a browser to get an answer.
As explained earlier, one could store and aggregate the data on one’s server to answer specific questions. However, this can be time-consuming and require large server capacities. The Graph claims to solve this problem with a decentralized protocol that indexes blockchain data and enables efficient and high-performance queries. These APIs (Subgraphs) can then be queried with a standard GraphQL API.
An example of storing data in a subgraph
- An NFT transaction takes place via OpenSea, conducted on the Ethereum blockchain with a smart contract.
- During the transaction, data are processed and made available, such as the buyer and seller, and the transaction amount.
- The Graph continuously scans the Ethereum blockchain. The system checks which information is required in one of the hundreds of Subgraphs and provides this information to the Subgraph. In our transaction example, it would be: “Hello Subgraph, please count +1 for the transactions, here’s the date and time”.
- The application can then easily retrieve this data and present them in a graphic.
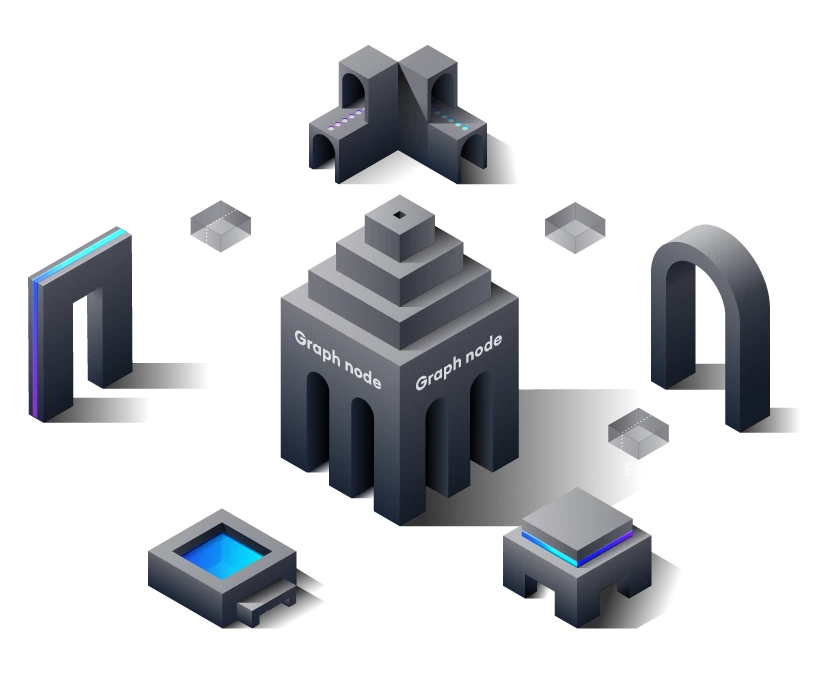
Which participants are there in the network?

The Graph explained in a 10-minute video
The YouTube channel Crypto Square released an animated video that explains The Graph in just under 10 minutes. The video is over a year old, but the fundamental principles of the project have not changed.
Please note that this service is currently not regulated under MiCAR and lacks the protections and oversight established by EU regulations. For comprehensive information on staking risks, please refer to the Special Terms and Conditions for Staking.
 iOS App Store
 Google Play Store