Crypto charts – An introduction for beginners

Ever examined the chart of a cryptocurrency like Bitcoin or Ethereum and wondered why it sometimes displays lines and at other times candles? Or why charts of the same coin or token can appear different over the same period? You’ve probably also heard about the ubiquitous “trend”, but what does it really mean?
Understanding a chart is a critical skill for trading, whether it involves stocks, currencies, or cryptocurrencies.
Line and candlestick charts
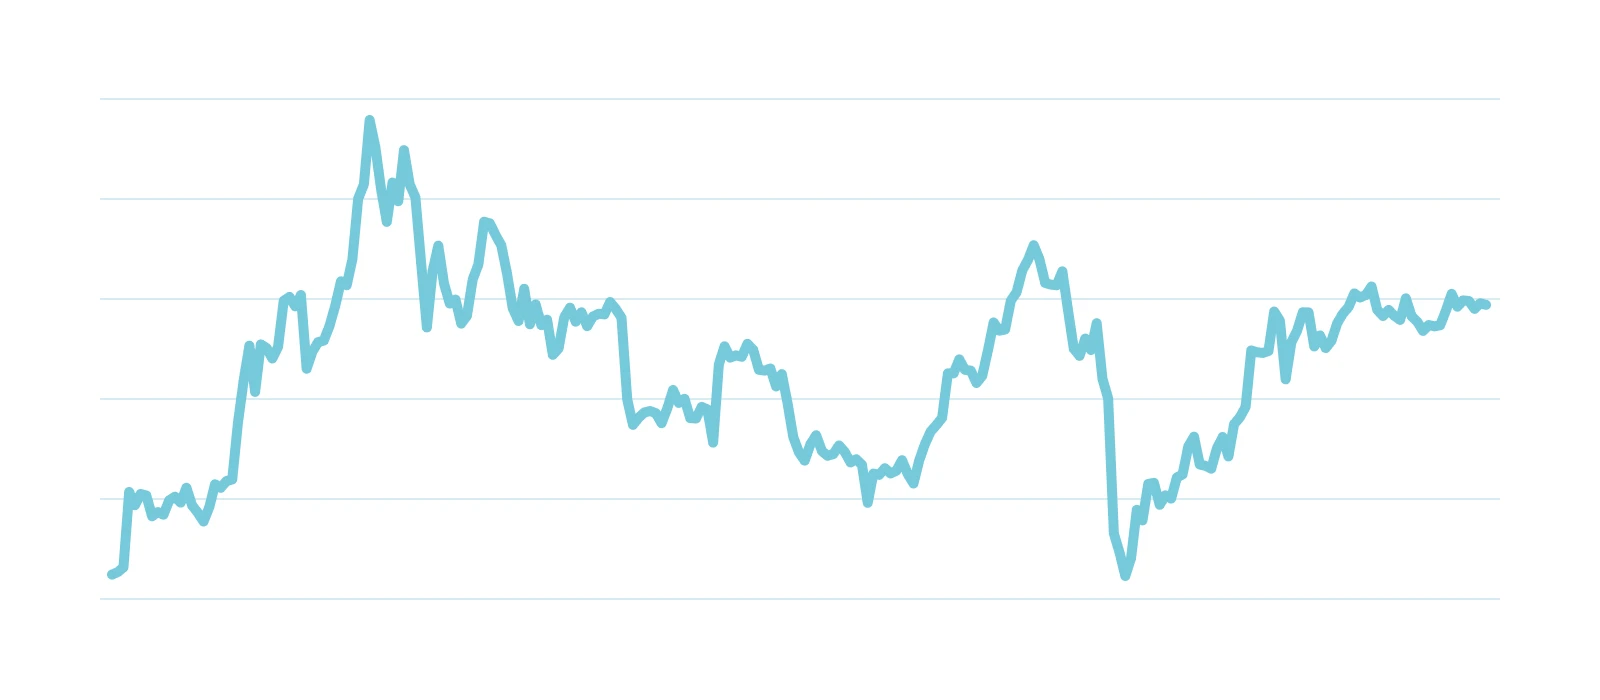
A line chart is the simplest type of price chart where the closing prices of a particular market or asset are plotted over a period of time, resulting in a price curve. This type of chart is most effective when comparing several time series.
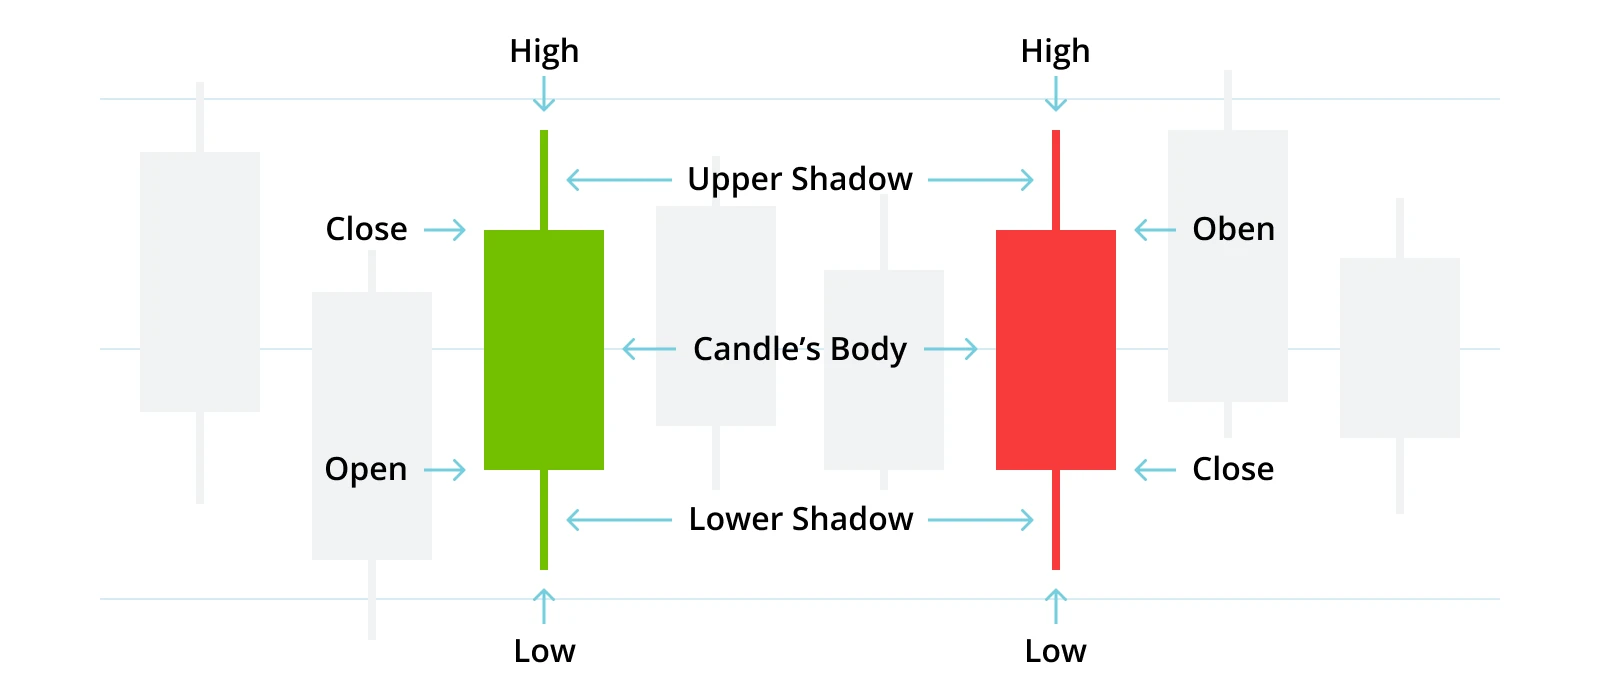
Candlestick charts are the Japanese version of bar charts and have become very popular in Western chart analysis in recent years.
They display four prices: the opening price, the daily high and low prices, and the closing price. The thin lines (wick and fuse) represent the daily range from high to low. The wick is the upper thin line or upper shadow above the candle body, and the fuse is the lower thin line or lower shadow below the candle body. The broad part (candle body) measures the distance between the opening and closing prices. If the closing price is higher than the opening price, the candle body is green or white (positive); if it is lower, the color of the body is red or black (negative).
The key element of the candlestick chart is the marking between the opening and closing prices. Candlestick charts can represent various time intervals, not only on a daily basis, but also on a minute-by-minute or monthly basis.
Arithmetic versus logarithmic scale
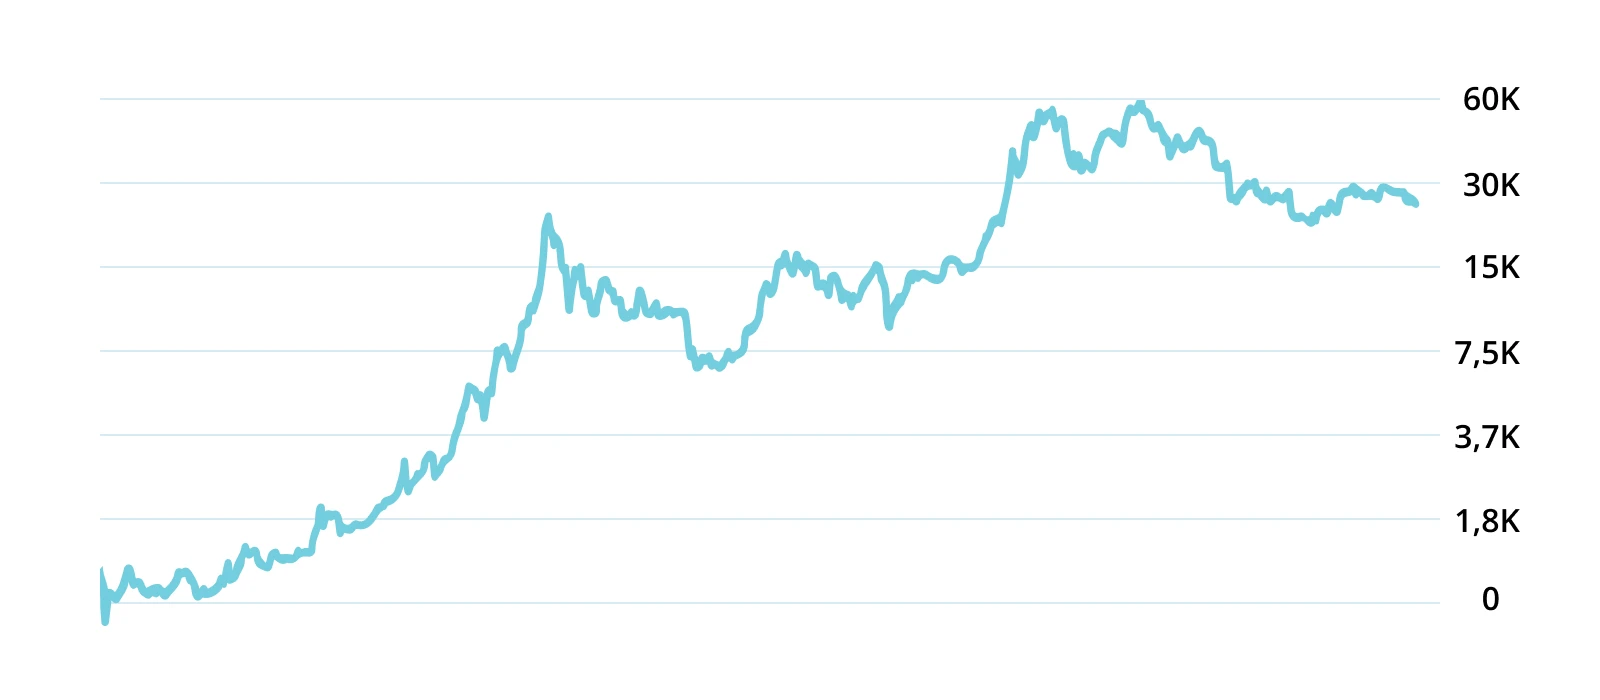
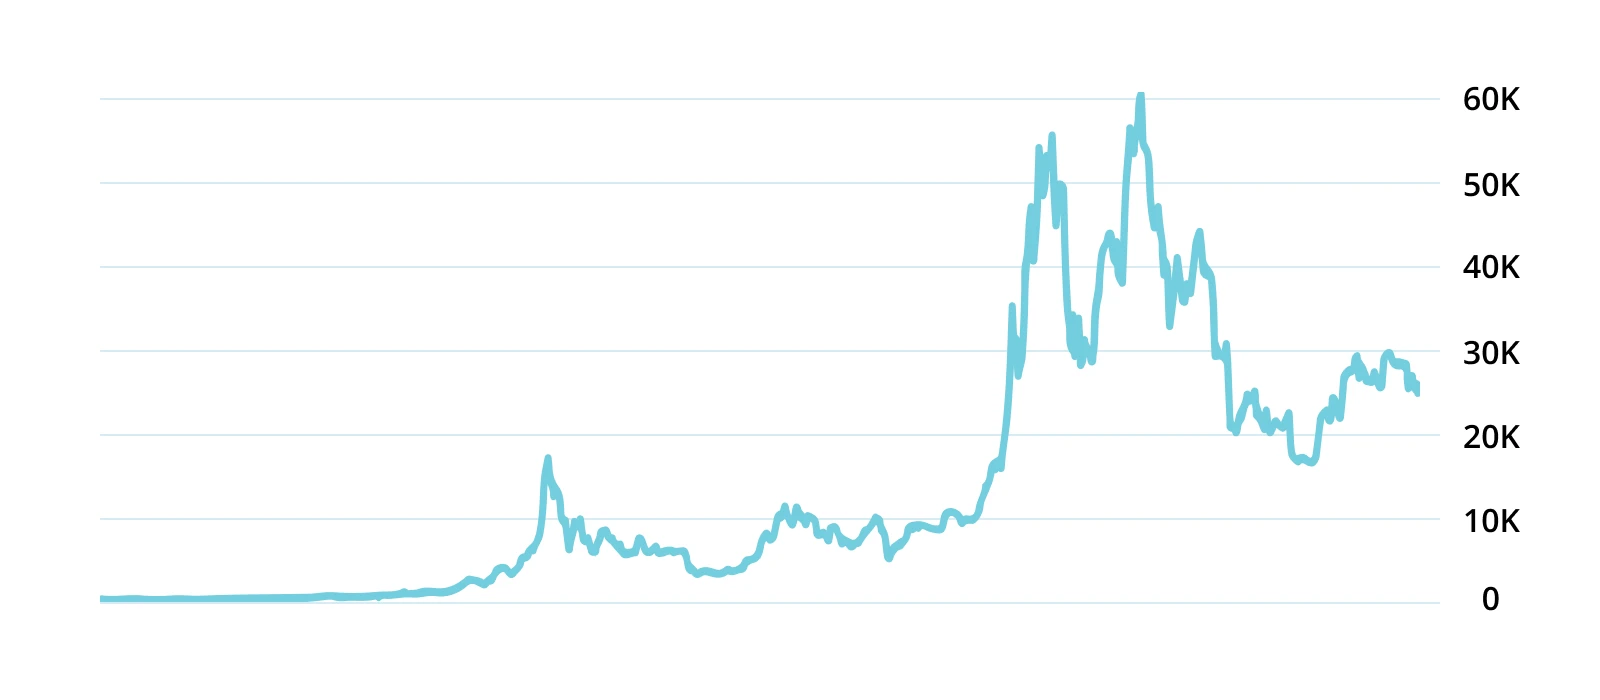
Charts can generally be represented with either an arithmetic or logarithmic scale. In the arithmetic approach, the vertical scale shows equal distances for equal price units, i.e. each point is equidistant.
With logarithmic scaling, the increments become smaller as prices increase. Prices on a logarithmic scale increase equal vertical distances for identical percentage changes, i.e. the price increase from 10 to 20 has the same distance on a logarithmic scale as from 20 to 40, or from 40 to 80.
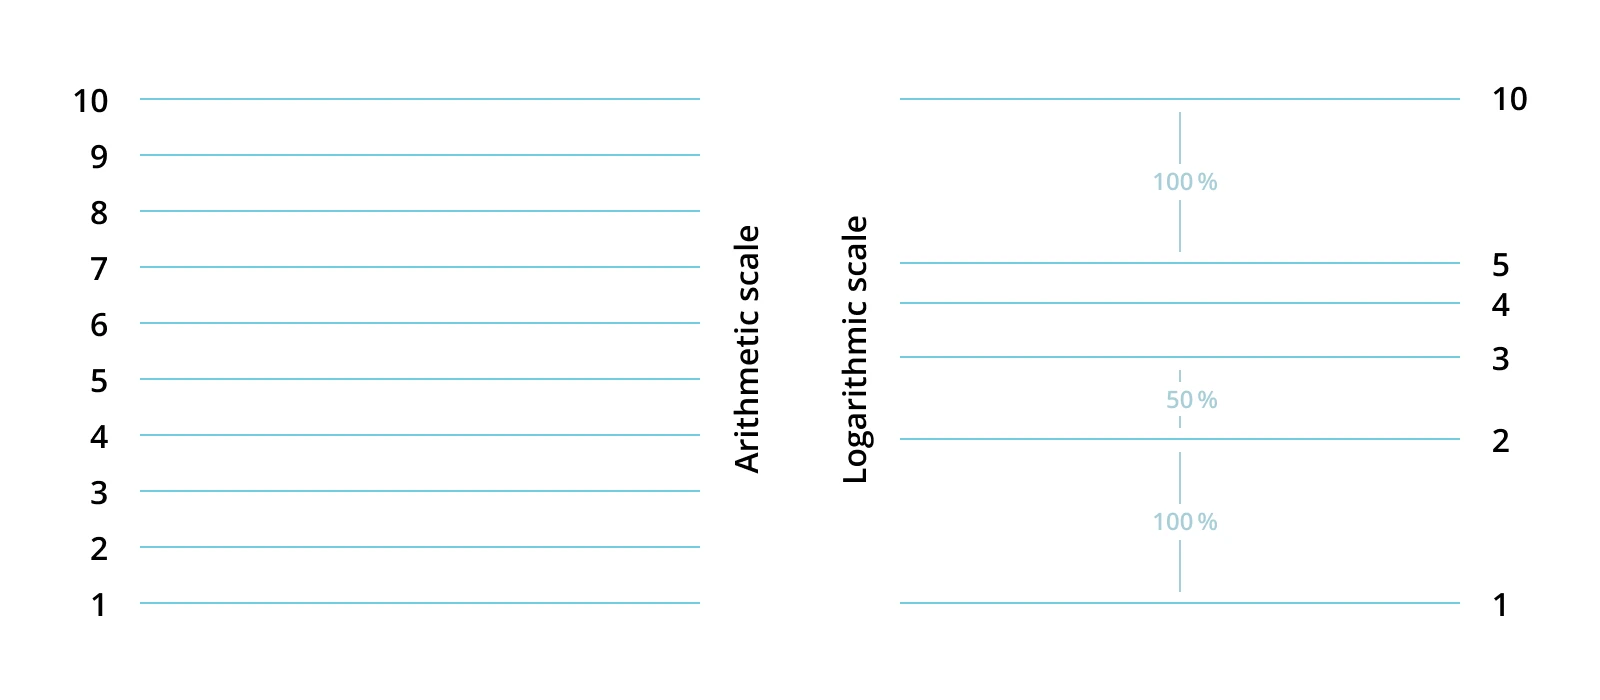
For long-term trend analysis and highly volatile investments like cryptocurrencies, the logarithmic representation holds several advantages over the arithmetic one. In Figures 4 (left – logarithmic) & 5 (right -arithmetic), the Bitcoin trend from early 2016 to the end of August 2022 is represented both arithmetically and logarithmically.
Trend
The concept of trend is absolutely crucial to technical market analysis. It refers to the general direction in which the market or an asset is moving. Neither markets nor individual stocks move linearly, but rather in a series of successive waves with relatively distinct peaks and troughs. It is the direction of these peaks and troughs that defines the trend.
An uptrend is a series of rising peaks and troughs, while a downtrend is a series of falling peaks and troughs. Equal peaks and troughs indicate a sideways trend. Although a directionless asset or market is considered a sideways trend, the term “trendless” is also often used.
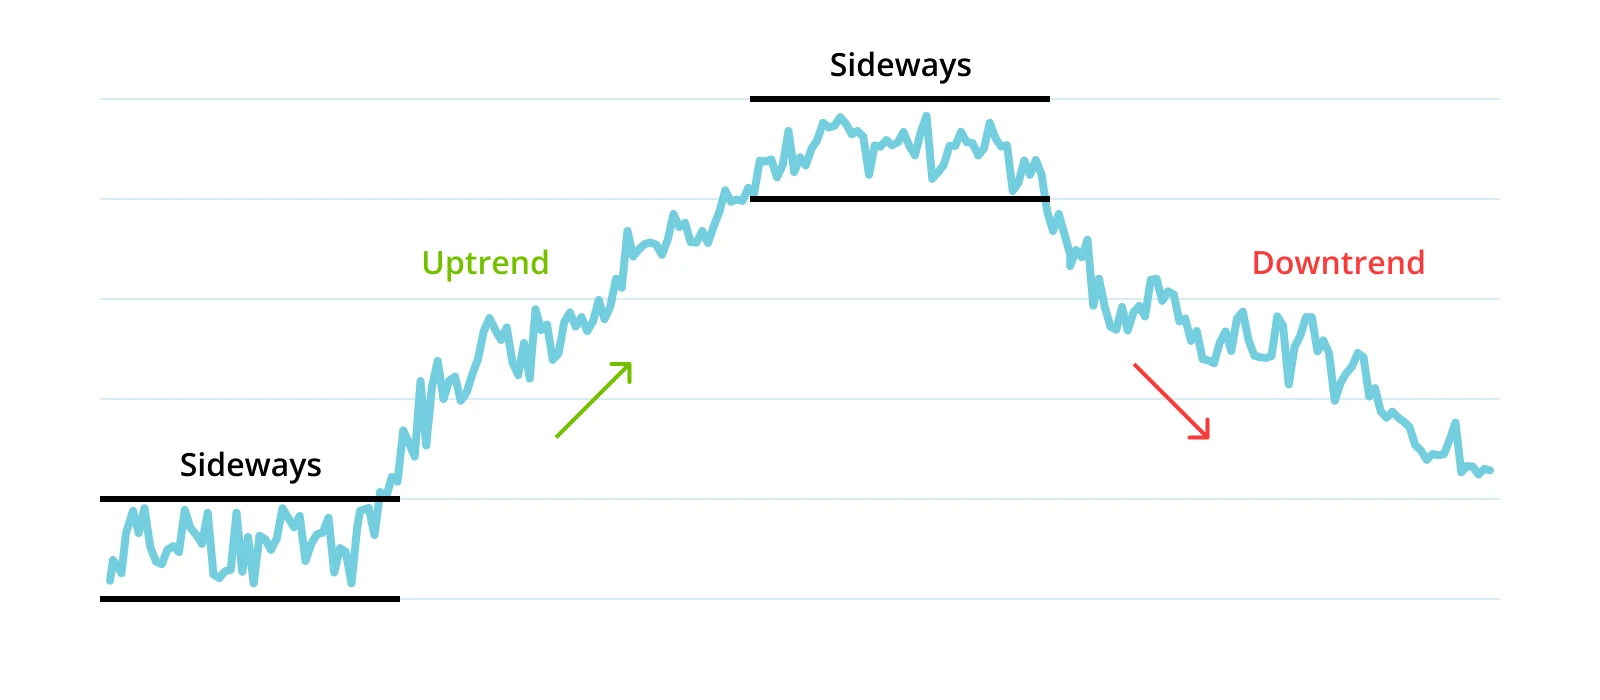
The classifications of a trend
In addition to the three directions a trend can have, it can also be classified into three categories: long-term, medium-term, and short-term trends.
However, it must be taken into account that there are actually an infinite number of trends, from extremely short-term trends that only last minutes, to very long trends that last several decades.
For example, the Dow Theory defines a major trend as lasting for longer than a year, intermediate or secondary trends from three weeks to several months, and short-term trends as less than two or three weeks.
Generally, any trend can be part of an even larger trend, i.e., the intermediate trend can be a correction within a higher-level (long-term) trend.
Understanding Technical Indicators: SMA & RSI
In addition to classic chart patterns, technical indicators offer even deeper insights into price movements. These indicators are based on mathematical formulas and use historical price data to identify potential trends or turning points.
Simple Moving Average (SMA) – Smoothing Price Trends
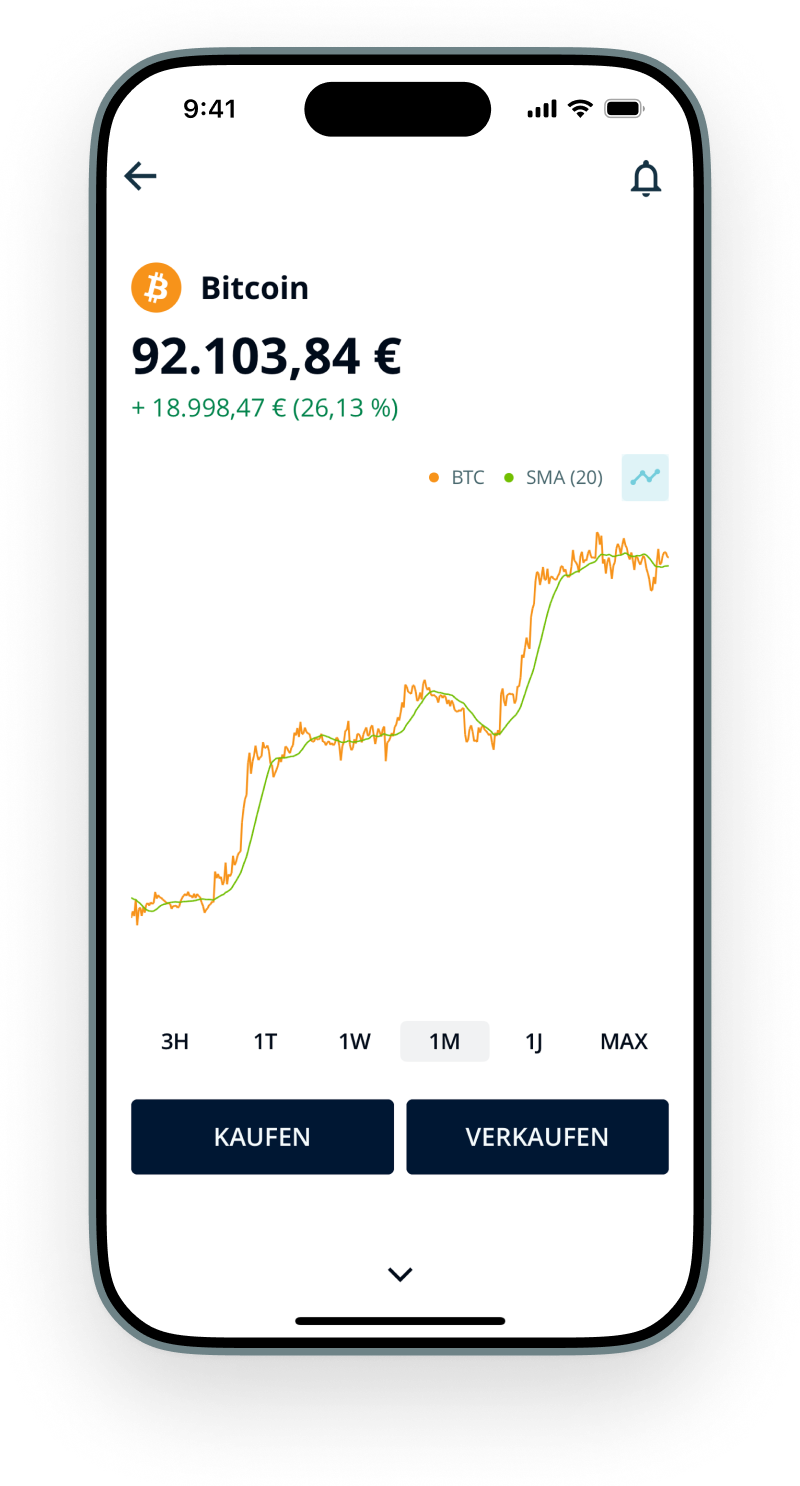
The Simple Moving Average (SMA) reflects the average price of a cryptocurrency over a defined period. It helps smooth out price fluctuations and reveals the overall trend direction.
How does the SMA work?
A 50-day SMA, for instance, calculates the average price over the past 50 days.
If the current price crosses above the SMA, it can signal a potential buy opportunity.
If the price drops below the SMA, it can be seen as a sell signal.
What is the SMA used for?
Primarily to detect trends:
A rising SMA suggests an upward trend.
A falling SMA may point to a downward trend.
Relative Strength Index (RSI) – Measuring Market Momentum
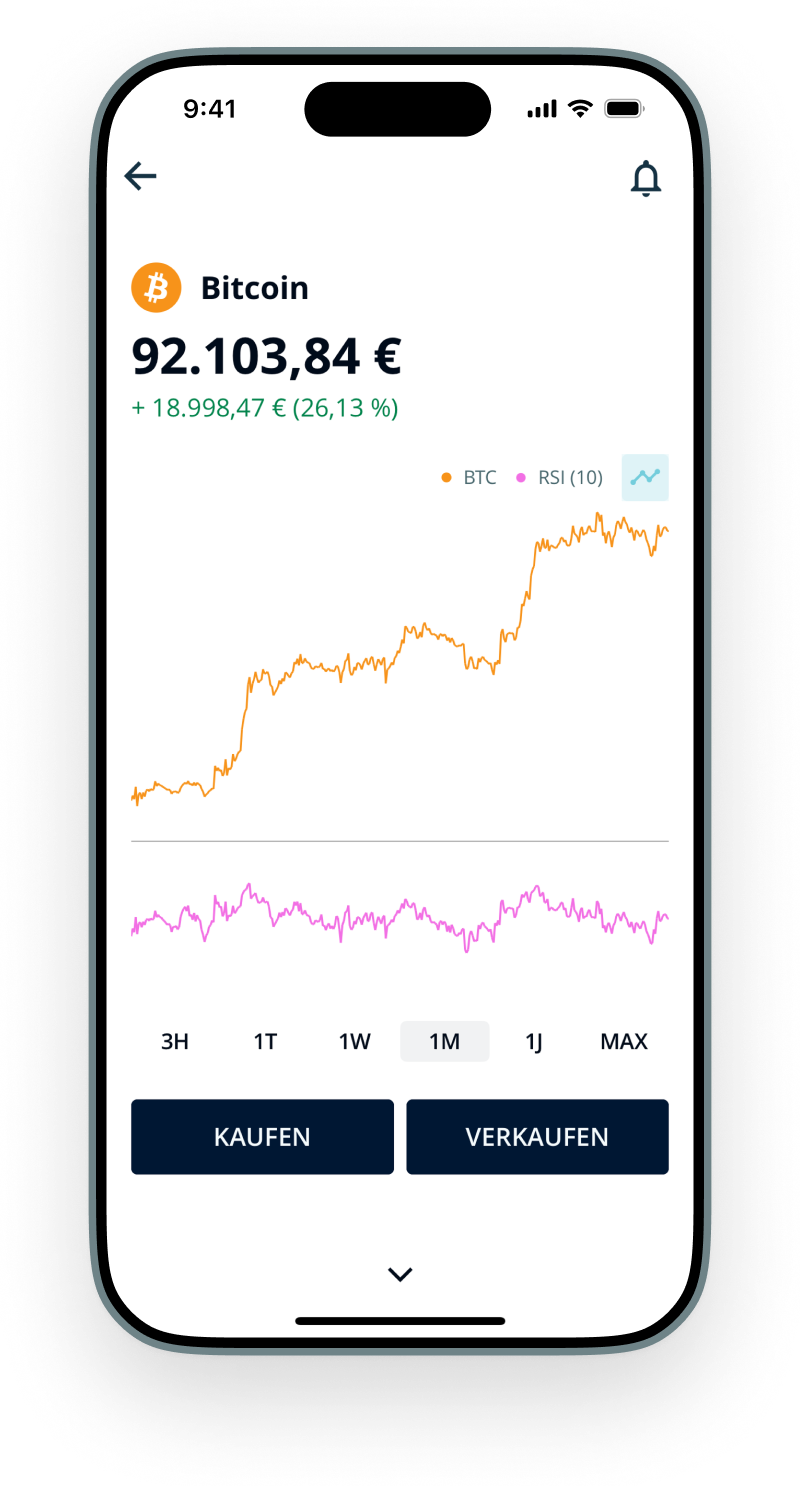
The RSI (Relative Strength Index) indicates whether an asset is currently overbought or oversold, helping assess if a correction or recovery might be on the horizon.
How does the RSI work?
The RSI ranges from 0 to 100 and analyzes the ratio of recent gains and losses over a set period.
RSI above 70 = overbought
RSI below 30 = oversold
What is the RSI used for?
A high RSI can indicate an upcoming correction.
A low RSI could suggest a possible rebound.
Sources
Arithmetic vs. Logarithmic Scale | Botspedia (no date). Available at: https://www.bots.io/botspedia/arithmetic-vs-logarithmic-scale , last accessed 06.09.2023.
Bitcoin price today, BTC to USD live, marketcap and chart | CoinMarketCap (no date). Available at: https://coinmarketcap.com/currencies/bitcoin/ , last accessed 06.09.2023.
Milton, A. (2021) “Reading Day-Trading Charts,” The Balance, 26 November. Available at: https://www.thebalancemoney.com/day-trading-charts-bar-candlestick-and-line-charts-1031028 , last accessed 06.09.2023.
Mitchell, C. (2023) “Trend: Definition, Types, Examples, and Uses in Trading,” Investopedia [Preprint]. Available at: https://www.investopedia.com/terms/t/trend.asp , last accessed 06.09.2023.
Disclaimer
The content of this article is for informational purposes only and does not constitute financial, investment, and/or trading advice. We strongly recommend that you conduct the necessary research before making an investment, and/or trading decision. Please note that past performance does not guarantee future results.
Liability of the Börse Stuttgart Group and its subsidiaries for the article is excluded.
